

subplot — GMT 6.7.0 documentation
docs.generic-mapping-tools.org
gmt subplotとは複数のグラフをタイル状に並べることができる機能です。
matplotlibにも同じようなオプションがあるみたいです。

【機械学習入門】matplotlibのグラフを入れ子に!subplotを使おう! | 侍エンジニアブログ
この記事では「 【機械学習入門】matplotlibのグラフを入れ子に!subplotを使おう! 」について、誰でも理解できるように解説します。この記事を読めば、あなたの悩みが解決するだけじゃなく、新たな気付きも発見できることでしょう。お悩...
www.sejuku.net
gmt subplot
gmt subplot begin [タイル行数]x[タイル列数] -F[f|s][大きさ] -M[各タイルの間隔] -A[ラベル開始文字][+o【ラベル位置オフセット】][+c【テキストボックスの余白サイズ】] [-SC【t|b】] [-SR【l|r】] -B[WSNE] -R[範囲]
※ Ff は全体図の大きさを指定する
※ Fs は各図の大きさを指定する
※ -SC【t|b】 -SR【l|r】は全てのタイルが同じ範囲を取る場合に使うのがおすすめ。
gmt subplot set [行,列]
※ 行列番号を指定しない場合は、「1行1列 → 1行2列…」の順に選択される。
2x2のグラフを作成する
素直なグラフならば、下記のスクリプトで描けます。
#!/bin/bash
gmt begin sample png
  gmt subplot begin 2x2 -Fs12/8 -M0.5 -A -SCb -SRl -Bwsne -R0/100/0/100
    gmt subplot set
    gmt basemap
    gmt subplot set
    gmt basemap
    gmt subplot set
    gmt basemap
    gmt subplot set
    gmt basemap
  gmt subplot end
gmt end
この結果が、
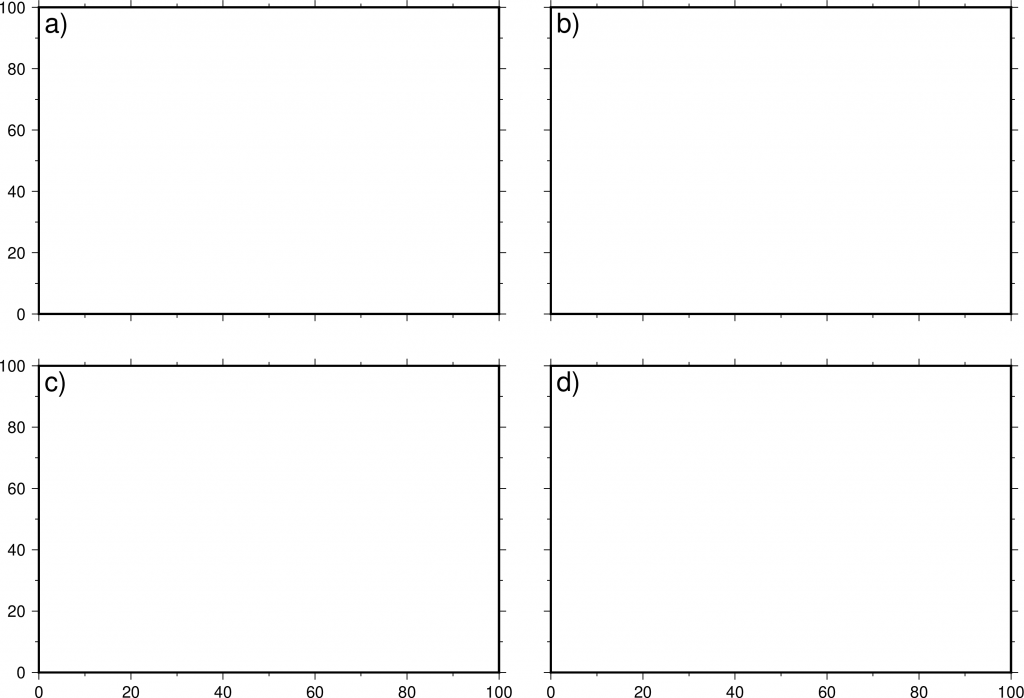
となります。
a)~d)まで同じ範囲を取る場合は、SCとSRを付けると見やすくなります。
なお、-SCt -SRr とすると、
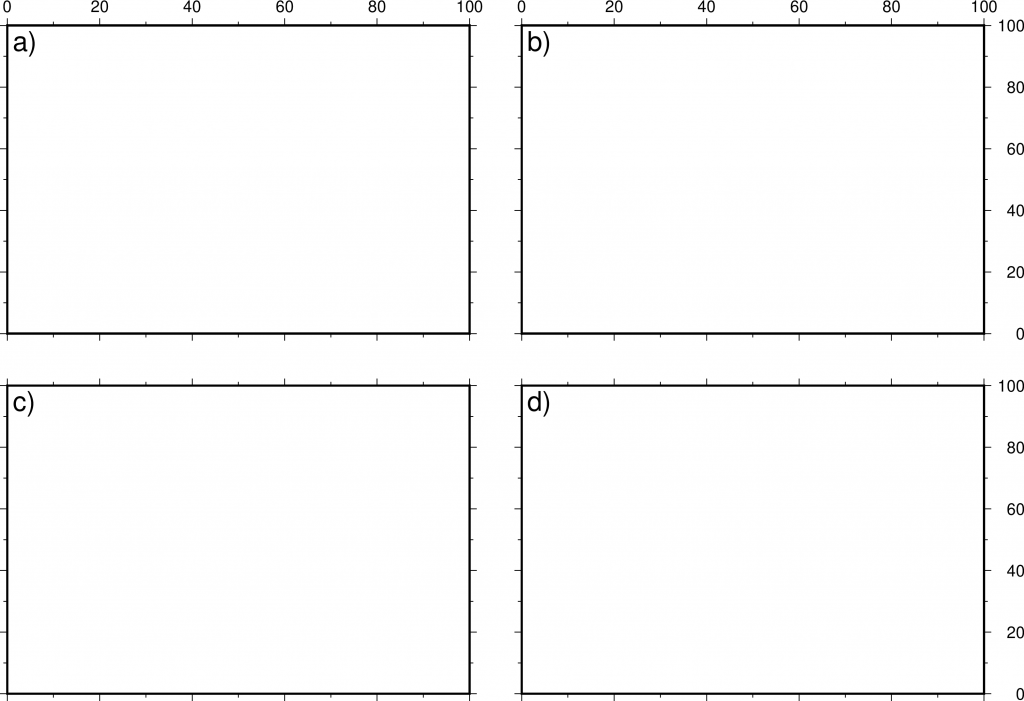
となります。
異なる範囲を取るグラフを取る場合
異なる範囲を取るグラフがタイル状に存在する場合は、SCとSRを外します。
#!/bin/bash
gmt begin sample png
  gmt subplot begin 2x2 -Fs12/8 -M0.5 -A -BWSne -R0/100/0/100
    gmt subplot set
    gmt basemap -R0/80/0/80
    gmt subplot set
    gmt basemap
    gmt subplot set
    gmt basemap
    gmt subplot set
    gmt basemap -R0/80/0/80
  gmt subplot end
gmt end
とすれば、
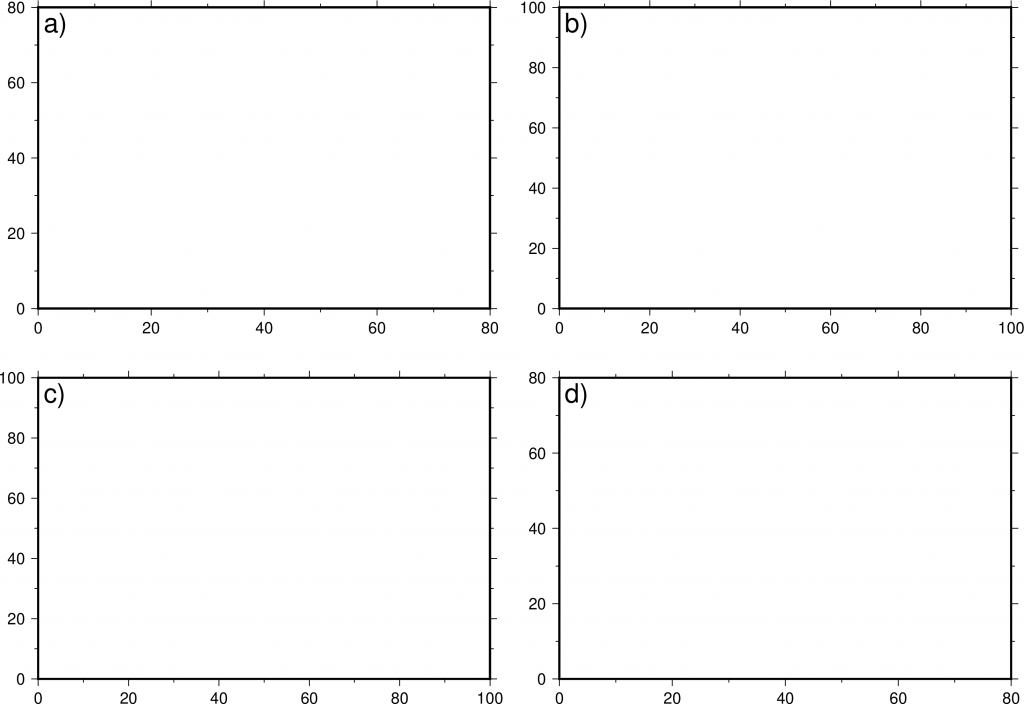
となります。
リスト見出しを変更する
a,b,c,dの表記が気に入らない場合は、-Aにて指定します。
#!/bin/bash
gmt begin sample png
  gmt subplot begin 2x2 -Fs12/8 -M0.5 -A1 -Bafg -BWSne -R0/100/0/100
    gmt subplot set
    gmt basemap -R0/80/0/80
    gmt subplot set
    gmt basemap -R10/120/0/80
    gmt subplot set
    gmt basemap -JX12/8l -R0/1000/1/100000 -Bya1pg0.5p
    gmt subplot set
    gmt basemap -R0/80/0/80
  gmt subplot end
gmt end
この結果が、
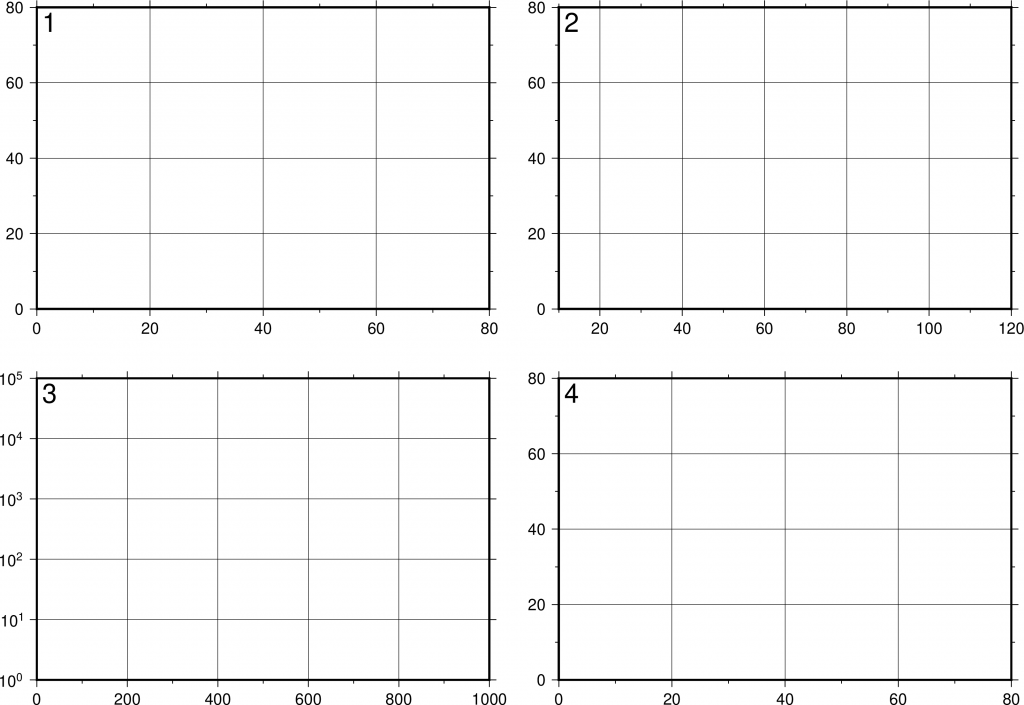
となります。


コメント